風船ポンポン 1.入力装置作成
ずっとやりたかった、風船を使ったインタラクティブな作品にとりかかります!
目標は、1ヶ月間でこどもに遊んでもらえるようなカタチまで作る
・・・頑張ります!汗
これ、本当は昨年末のクリスマスに大々的に実践したかったんですが、
当時は公私でバタバタしてて自主制作どころじゃなかったです。。
海外から極小Arduinoとか面白アイテムとか大量に買い込んでたんだけどなぁ、トホホ。
結局、風船にレインボーLED入れて床に置いただけでした。
それはそれで、子供もはしゃいで楽しんでくれたのでよかったですけどね!
 やっぱり「触れる」のって楽しい!
さて、とりあえず今回は、風船タッチテストに便利なように入力装置作ってみた。
風船の中にショックセンサー入ってます。
空気抜けないように、ホットボンド多用しました。

データの流れは
風船の中のショックセンサー → Arduino → Mac (Processing)
とりあえず今日はここまで笑。
以下は、昨年末のショックセンサー初テストメモ(書きなぐりですが)を転載。
yoppaさんのサイトにはいつもお世話になってます。
---------------------
2016.10.15 memo
---------------------
初のアナログデータのグラフ(プロット)視覚化!!!!たのしい。
ショックセンサーからArduinoにアナログ入力(0~1024)、
それをProcessingでグラフ化!!
それをProcessingでグラフ化!!
今回のミソ
※複数個のデータが1つにまとまったデータ群(時系列データ)のシリアル通信 ★★
→要は、Arduinoで , で区切ってひとまとめにして送信。Processingで , で区切って分解。
【テスト】
目的:
ショックセンサーの入力をProcessingに送信してビジュアル化
手順:
目的:
ショックセンサーの入力をProcessingに送信してビジュアル化
手順:
①ショックセンサーから値入力 (アナログ 0~512)
それをArduinoで 0~255にリマップ
それをArduinoで 0~255にリマップ
②シリアルでProcessingに通信。 <ここまでArduino処理>
・・・例: 0,0 \n 512,255 \n 200,100
③Processingでグラフにプロット , を読み取り値を分解。
シリアル通信を読み取る。読み取ったデータをyの値としてsensors[]に一旦格納。
それをx方向に追加していく。端までいったら新しいページに描画。
以下スケッチ
===========Code: Arduino ===============
===========Code: Processing=============
===========Code: Processing=============
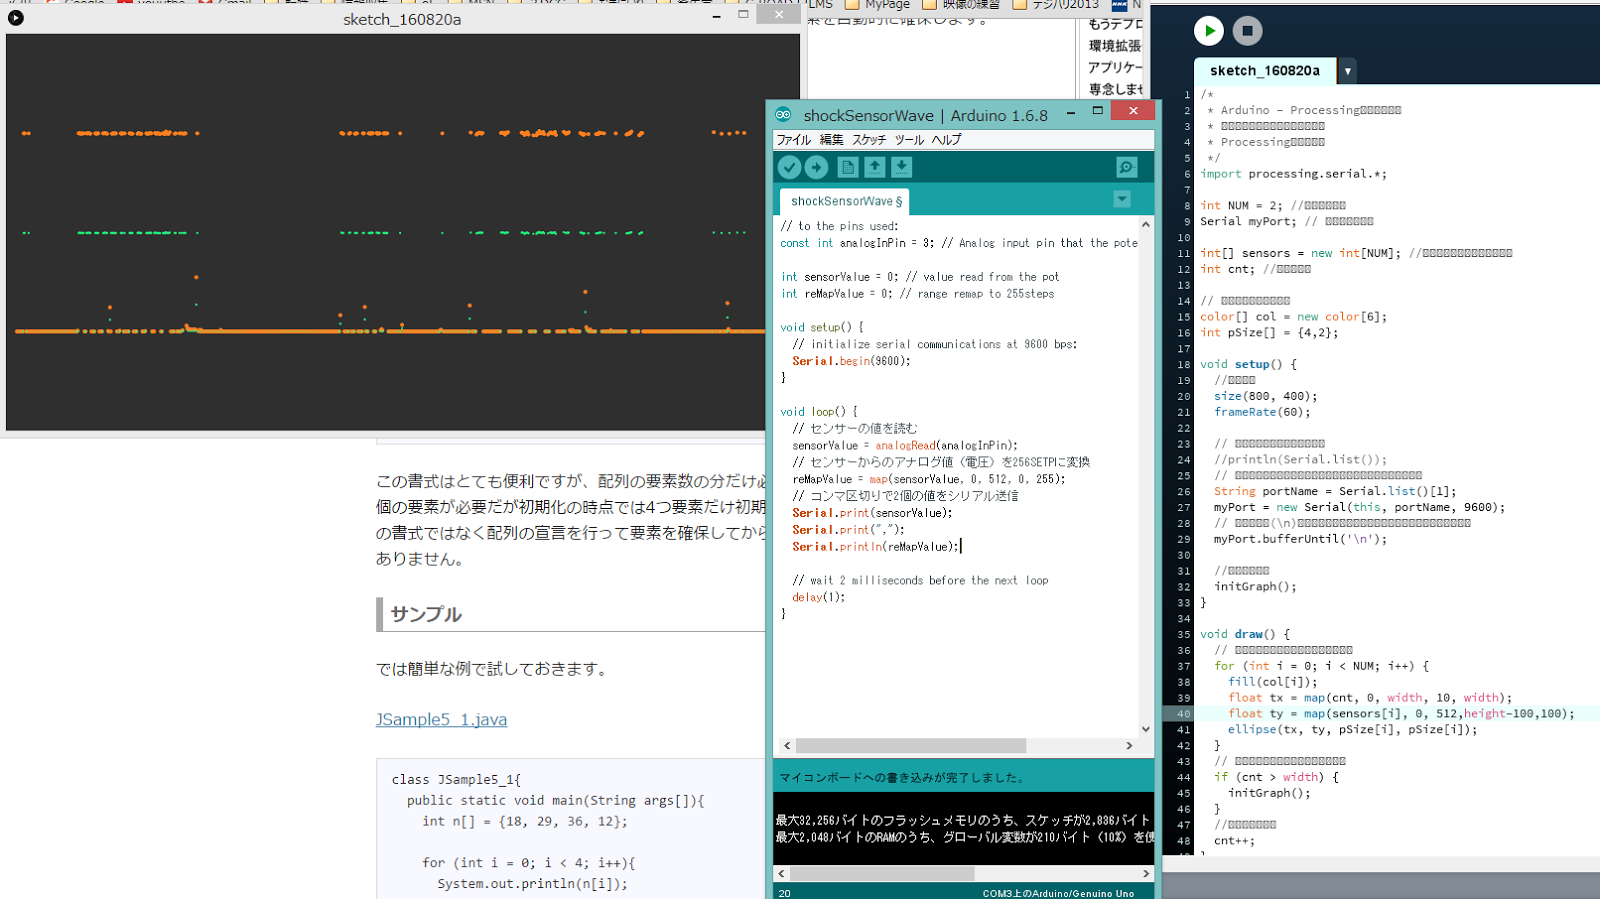
スケッチと実行結果
横が時間軸、センサーが反応したところで点が上下している。


/*
返信削除* Arduino - Processingシリアル通信
* センサーの値をグラフにプロット
* Processing側サンプル
*/
import processing.serial.*;
int NUM = 2; //センサーの数(今回はオリジナルデータと、255範囲にマッピングしたもの)
Serial myPort; // シリアルポート
int[] sensors = new int[NUM]; //センサーの値を格納する配列
String[] sensorName = {"data1 Original 512steps","data2 Mapping 255steps"};
int cnt; //カウンター
// グラフの線の色を格納
color[] col = new color[6];
int pSize[] = {4,2}; //異なる2つのプロットサイズで
void setup() {
//画面設定
size(800, 400);
frameRate(60);
// シリアルポートのリスト取得
//println(Serial.list());
// ポート番号とスピードを指定してシリアルポートをオープン
String portName = Serial.list()[1];
myPort = new Serial(this, portName, 9600);
// 改行コード(\n)が受信されるまで、シリアルメッセージを受けつづける
myPort.bufferUntil('\n');
//グラフ初期化
initGraph();
// グラフ描画の線の色を定義
col[0] = color(255, 127, 31);
col[1] = color(31, 255, 127);
}
void draw() {
background(0);
GndLine(100); //グラウンドライン
// センサーの数だけ、グラフをプロット
for (int i = 0; i < NUM; i++) {
float tx = map(cnt, 0, width, 10, width); //左に余白10
float ty = map(sensors[i], 0, 512,height-100,100); //上端がy=0のため、下端をベースに描画するにはこのリマップ← ※上下余白 100
fill(col[i]);
ellipse(tx, ty, pSize[i], pSize[i]);
text(sensorName[i]+" = "+sensors[i],16,16+16*i); //センサーの値を表示
}
//振動に反応する円
ellipse(400,200,sensors[0],sensors[1]);
// 画面の右端まで描画したら再初期化
if (cnt > width) {
initGraph();
}
//カウンタアップ
cnt++;
saveFrame("image/shockSS01_###.png");
}
//グラフの初期化
void initGraph() {
cnt = 0;
}
void serialEvent(Serial myPort) {
// シリアルバッファーを読込み
String myString = myPort.readStringUntil('\n');
// 空白文字など余計な情報を消去
myString = trim(myString);
// コンマ区切りで複数の情報を読み込む
sensors = int(split(myString, ','));
}
void GndLine(int col){
stroke(col);
line(0,300,800,300); //グラウンドライン
noStroke();
}
↑
返信削除Processingのスケッチ更新。
センサーからの値は1つだが、Arduinoでオリジナルとリマップ(0-255,0-512)の2つの値がシリアルでPRocessingに送られる。そのあたりの整理と、送られた値で円の大きさが変わるなどの細かい調整。
課題
変化が大きいのでダンプ効果を入れたい。
滑らかに円の大きさが変わるように。